
Sampling
 |
Today, I’m going to take a look at sampling and confidence levels, and I’m going to try and do it without descending into heavy math and statistics. I’m going to attempt to explain the concepts using common sense and thought experiments. |
|
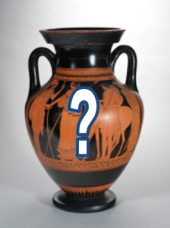
Imagine you have a Greek Urn, and inside it are 100 marbles. There are 50 black marbles and 50 white marbles (all thoroughly mixed). An equal combination. You close your eyes and pick out ten balls, at random, from the urn. Then you open your eyes and examine the results. What’s the most likely result?
Common sense tells you that, most likely, you’ll get five black marbles and five white marbles (and the math backs this up; it is the most likely outcome). But it would also not rock your world if you drew six of one color and four of another. You’d probably also not lose sleep if you drew seven of one color and three of the other either. It’s less likely that you’d get this asymmetry, but it is possible. It is even possible for all ten drawn marbles to be black (just not likely, in fact less six chances in ten thousand, but if you did it enough times, it could happen). And let’s not even mention what would happen if we sampled in batches of nine, not ten (where it is not even possible to draw an equal number of black and white marbles!) |
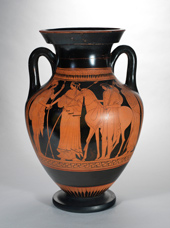 What’s a Greek Urn?About 15 Euros/hour(Thank you, I’m here all week) What’s a Greek Urn?About 15 Euros/hour(Thank you, I’m here all week) |


 |
Statisticians call these experiments sampling experiments. There’s a universe (population) of a hundred marbles in total, and from it you are drawing samples of ten. Using these samples, which we’ll call observations, you can estimate (guess) at the composition/distribution of the all the marbles in the urn, but you can’t be sure. It’s sort of like peeking through a small window into a room beyond and trying to imagine the whole scene. |
|
If we repeat the experiment over and over and over again we’ll see that expected (more likely) outcomes occur more frequently, and the less likely outcomes occur less frequently. It's like looking through lots of different windows onto the same scene (which has been juggled around between each viewing); even though each time the scene changes, over time you get a better idea of what is on the other side. Below are a series of graphs generated by simulation. (I wrote a program to model the urn and randomly draw a sample, then repeated the experiment again, and again, and again). |
|
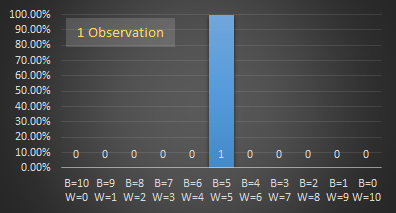
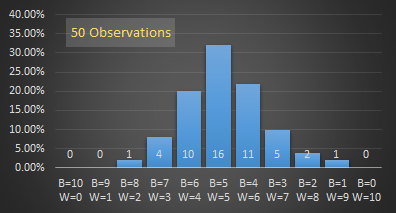
On each graph, the x-axis shows the breakdown of balls in the sample, with the far left representing all black balls, and the far right representing all white balls. For each combination of marble mixture there is a bar column showing the number of times this combination of marbles was selected. The y-axis shows what percentage (of all the experiments run) each bar represents. With just one trial, the bar is at 100%, for two trials, both are 50%, (assuming a different distribution of marbles was drawn). The fancy term for this is ‘normalization’ and allows the graphs to all be drawn on the same scale, irrespective of the number of experiments performed.
 |
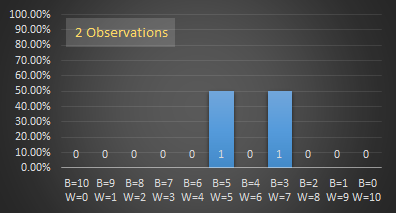 |
With just one observation, the best we can guess of the actual distribution is a scale up of the observation. In this example, it's a 5:5 mix which, since we know the distribution, is the most likely, but it could have been 6:4. Two observations show the results of looking through two windows.
 |
 |
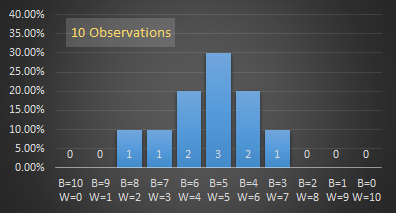
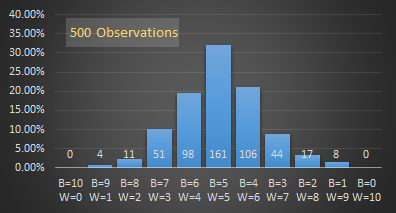
As the number of observations increases, a pattern starts to emerge. The more likely outcomes occur more often.
 |
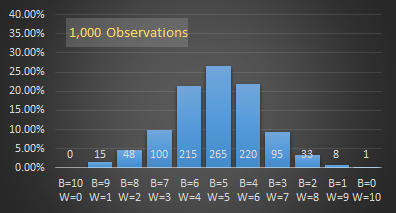 |
As you can see, the more samples (observations) we take, the smoother the graph becomes, and the more likely outcomes (those near the middle of the graph) appear. The graph is also symmetrical around the middle.
 |
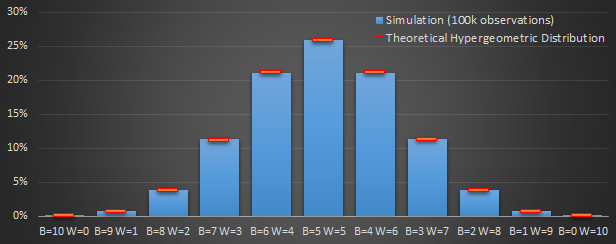
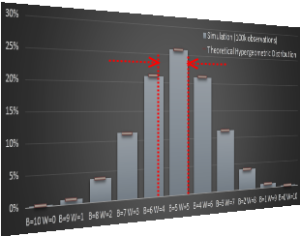
I promised to avoid math, but for completeness, here are the theoretical expected breakdowns of the probabilities in table form, and also plotted on graph (in red) alongside the results of a computer simulation of running the experiment 100,000 times. Without derivation, I’ll show the formula here for how to calculate the probability, and say that if you want to learn more about this, do a web search about Hypergeometric Distribution. (These curves are not Binomial curves because the marbles are selected without replacement; each marble drawn adjusts the concentration of marbles left). |
|
N = Population size (100) K = Number of black marbles (50) n = Sample size (10) k = Number observed (k) |
As you can see from the graph below, with many observations, the simulation matches the theoretical probabilities very nicely.
|
 |
The above thought experiment sets the scene for the next section. We've shown that, even when we know the exact distribution, if we have to sample, then there is a range of possible outcomes, and we can never be completely certain.
Statisticians deal with these kinds of things every day. They poll audiences, they analyze results, they sample, model and summarize. Most of the time they never have access to the entire population, instead they inferring distributions from the windows they have on the data.
Let’s now look at the problem from the other side …

Inverting the problem
|
Now, imagine a new urn is brought in front of you. This second urn also contains 100 marbles that are either black or white, but you do not know their breakdown! There could be anywhere between zero and 100 black marbles, and the appropriate number of white marbles to make up the balance. You draw ten marbles out, as before, and this time you get seven black, and three white. What can you infer from this?
Well, clearly there have to be at least three white marbles in the urn, and at least seven black marbles, but that is where your certainty stops. |
 |
 |
If you had to estimate the breakdown/distribution of the marbles based on this one sample, you could speculate that there are seventy black and thirty white marbles, but how confident are you? As we learned from the first experiment, just because there was a 7:3 ratio in the sample, it does not necessarily mean there is this same ratio in the urn. From the graphs/data above we can see, for instance, that it's perfectly possible to draw 7:3 marbles from an equal mix (in fact this will happen over 11% of the time with a balanced mix), whilst not the most likely, it is possible. |
Confidence
|
We could repeat this experiment again, and again … (Maybe getting 8:2 and 6:4, and possibly a 5:5, followed by two more samples of 7:3) The more times we run the experiment the more confident we can become of our answer. The more observations we obtain, the more conviction we can give to our prediction. |
 |
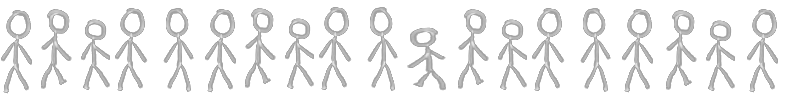
Subtly, when you are sampling, you can never be 100% certain. If you never poll 100% of the population, you can never be 100% sure. Imagine there are 100 people in a room, and you pull out 99 of them at random to see if they are male or female. Then do it again, and again. Even if, every time you do this experiment, you only ever see that there are 99 males, there could be a chance that the one person left in the room each time is female. Only if you extracted all 100 people from the room at the same time could you be absolutely certain there were no women in the room. The more often you repeat the poll, the more confident you can be in your belief, but you’ll never get to 100% certainty.
So what is good enough?
Confidence Levels
Recall back to the distribution curves from out first urn experiment. The sample distributions were more likely to occur at the 5:5 point, which was the average outcome over many samples (the mean). The asymmetric observations become less likely, the further away from the mean. As we get to the outer tails, the probabilities become very unlikely.
 |
With confidence levels, what we are really doing is inverting the problem. Imagine that you could control the true distribution and could slide it backwards and forwards and say how confident you are that the samples we observed could have come from that distribution. (We can select any confidence level we like, but it is common in statistics to select a 95% confidence level). With this confidence level defined, we will get a range of values. We can say "We are are 95% confident that the samples we observed could be explained with by a distribution of marbles in this range". It might be a subtle semantic difference, but we are not saying that there is a 95% chance that the true distribution lies within this range. We are saying we are 95% confident it could be explained by something in this range. |
I promised to avoid the math (though it's not tricky), but here's the process we'd follow:
For all the observations we make, work out the mean (average). You can see how the more observations we make, the better the value of mean becomes. Again, this makes sense. From the observations made, the most likely guess is, of course, the average of all the experiments we have performed.
Next we want to calculate the Variance of the observations (the average square of the distance of each observation from the mean*). How close are they clustered around the mean? A high variance is observed when the data is scattered wide. A low variance is observed when there is a small spread between observed data.
The variance is used to calculate the Standard Deviation which is 'the average deviation from the average'.
*Well, strictly speaking instead of summing up the errors, squaring and dividing by the number of points N, we divide by N-1 (followed by the square root to calculate the Standard Deviation). This is called the Sampling Standard Deviation which is a better representation when data is a selection, as opposed to the Population Standard Deviation which is used when dealing with an entire data set. If you want to know the reason, find a Statistics Professor and ask him/her the difference between a biased and unbiased sample.
A high standard deviation (σ) indicates a wide scattering and distribution (and would result in broad confidence range). A low standard deviation indicates that all the samples taken were close together and thus, for the same confidence threshold, we could get a tighter fit.
Central Limit Theorem
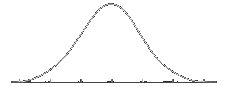 |
There's a very important theorem in statistics, called the Central Limit Theorem that states that the distribution of the average of a large number of independent, identically distributed, variables will approximate a normal distribution (regardless of the underlying fundamental distribution). What this means is that, if you repeat the same experiment over and over again, then the distribution of the average of the results should follow a normal curve (also called a Bell Curve, or Gaussian Distribution). |
|
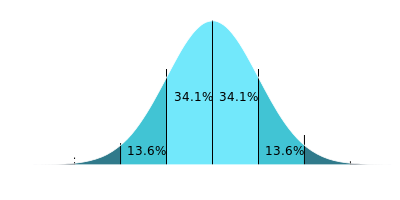
The equation for the shape of a normal curve is known, and it's the area under the curve we care about. A confidence level of 95% corresponds pretty closely with ±2σ (At ±1.96σ we expect to capture 95% of observations that are normally distributed). It would be inappropriate to say that, just because we sampled and drew a selection of marbles in a certain distribution, that we can scale up and say the entire population has the same distribution. Instead, what we say is that, based on the observations we witnessed, we can specify the range of possible proportions for the population that could be explained by the results we obtained with a 95% confidence. |
 |
Example
|
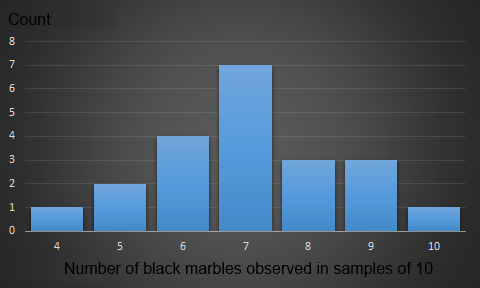
To the left are the results of 21 independent pulls of ten marbles from our second urn. The mean of the samples is 6.90 black marbles, with a standard deviation of 1.45 It's easier to work with normalized numbers so we'll convert the observations to fractions of black marbles (from 0.0 for all white, to 1.0 for all black). The mean is 0.690 and the standard deviations is 0.145 Plugging these values into a formula that calculates the confidence range (We take 1.96x the standard deviation over the root of the sample size), we get a 95% confidence range of ±0.062 |
Using the example data we can say that, based on our observations, we are 95% confident that the results could be obtained from a jar containing somewhere between 69.0 ± 6.20 black marbles (62.8-75.2)
You can find a complete list of all the articles here. Click here to receive email alerts on new articles.
© 2009-2014 DataGenetics Privacy Policy