
Data Mining using just names
Before readying this article, you might want to read the previous posting What's in a name (if you have not done so already!)
Be sure to remember to click the back button when you are done. It’s OK, I’ll wait for you. Back? Good, let's carry on …
Androgynous Names
I’m sure we’ve all encountered a situation similar to this to this:
“There’s someone called ‘Taylor’ here to see you”
You’ve never met ‘Taylor’ before. Is Taylor a man or a woman? It’s one of those names that can swing either way. Using data from the SSA (Social Security Administration), we can count the number of female births and male births for each name to determine the percentage gender breakdown. A couple of random examples are shown below:
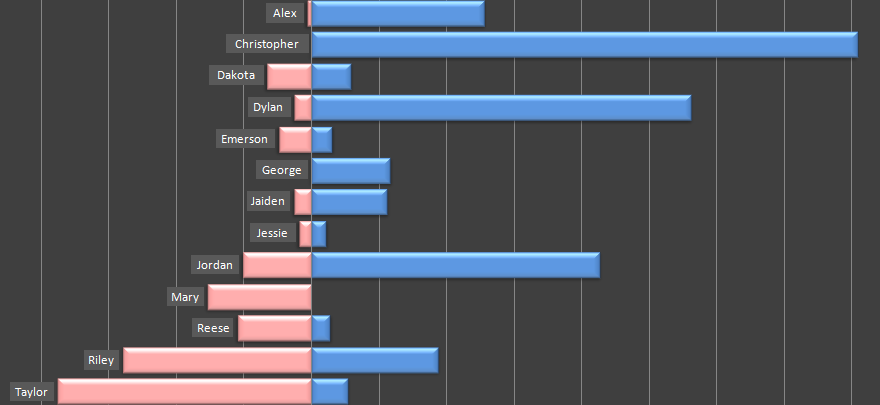
Some names are obviously female, for instance, Mary. Others, like Christopher and George are pretty universally male. Then, there are those that are androgynous, such as Jessie (which is 53% Male), Taylor (13% Male) and Riley (40% Male). These names, to varying degrees, can be used as both male and female names.
Hold on though. The above chart was based on 2009 birth date. In 2009, 87% of Taylors born were girls. But of course, we don’t just interact with newborns! If I meet a Taylor tomorrow, it could be a Taylor of any age, so if we base our weightings entirely on the most recent name percentages, we’ll be using an inaccurate number.
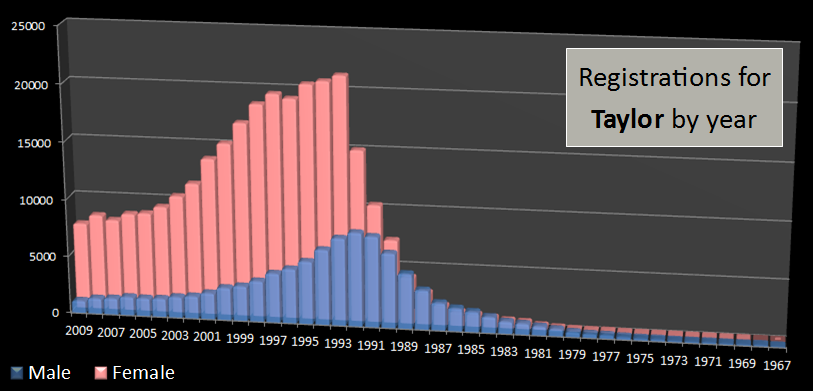
Compound this with the fact that, whilst in 2009, Taylor was a popular name (It’s the number #298 most popular boys name with 1,083 registrations, and the number #22 most popular girls name with 7,517 registrations), half a century ago, it was far less common. In 1967, for instance, it was the #811 most popular boys name with only 80 registrations, and #3648 most popular girls name with just 14 registrations.
The graph below shows the number of registrations of the name Taylor by year and gender. As you can see, the popularity of Taylor peaked in 1993 for girls, with 21,265 registrations in the USA, and in 1992 for boys, with 8,238,
Death
Nobody lives forever, so it’s impossible that the Taylor we may meet was born in 1890; that would mean (s)he would be 120 years old!
It’s also highly unlikely that the Taylor we may meet was one of the 88 Taylor's born in 1925 (making them 85 years old today). Granted, 85 years old is not massively ancient and many people do live this old, but not everyone does. What we need is a measure of expectancy that gives us the percentage of people that live to a certain age. Such a curve is shown below:
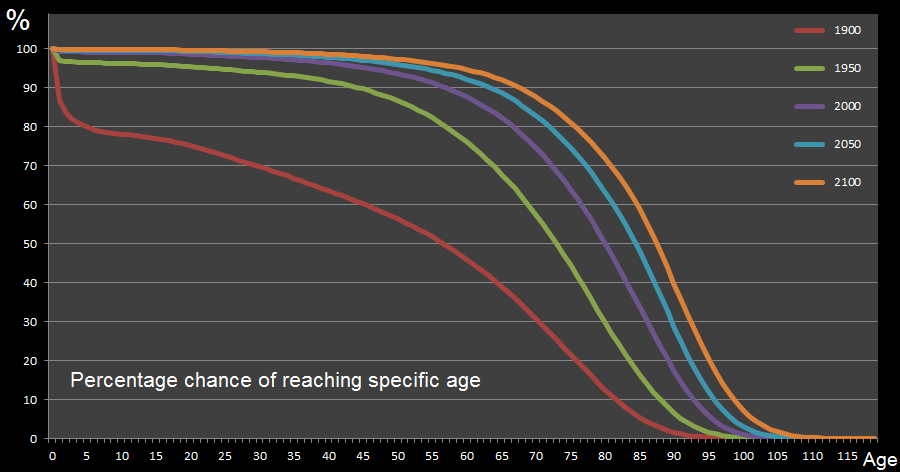
As you can see from the above curve (The date for these curves comes from the CDC/NCHS – Center for Disease Control and Prevention/National Center for Health Statistics) there’s an added complication in that one’s life expectancy varies depending on when you were born. People born in 1900’s have a much poorer life expectancy that people born in the year 2000. This should be no surprise; every year we get better medicines, and understand more how to cure, fix and prolong life. (Intense) manual labor is not as prevalent these days, and there are less globally-appalling wars. The combination of all these things means that, as time goes on, life expectancy is improving.
To read the chart, look up the age along the x-axis, then follow it up to the line corresponding to the year of birth. The percentage at the intercept represents the percentage of people, born that year, who, on average, will survive to at least that age.
For example below, 39.1% of people born in 1900 will attain the age of 65 or higher. This increases to 67.9% for those born in 1950, 82.4% for those born in 2000. 88.7% is the projection for those that will be born in 2050, and by 2100 it is predicted that 92.1% of people born will attain at least the age of 65.
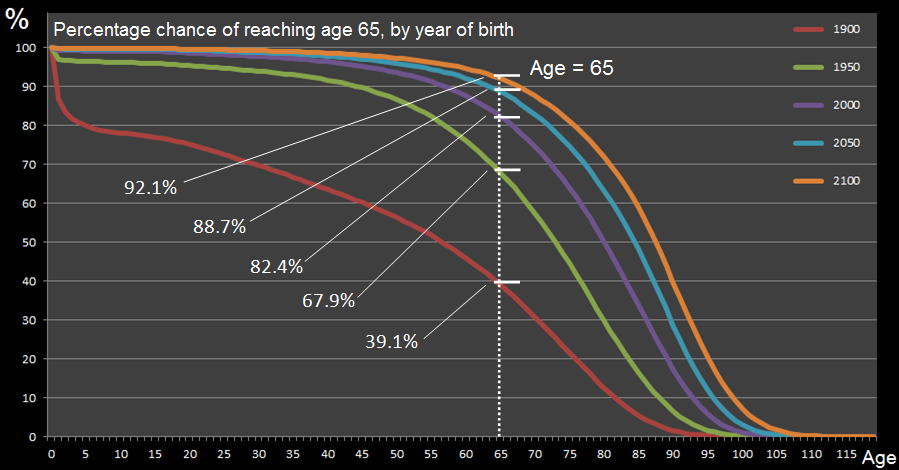
(It’s tragic to look at the far left of the red curve. In the 1900’s, the first few years were pretty traumatic for young children; 13% of those born did not make it to their first birthday, and 20% did not make it to five years old. Things were a lot better in 1950, shown by the green line, where 3% did not make it to one year old. Thankfully, in 2000, first year mortality has been reduced to 0.7%, and by 2100, the projections have it at 0.1%)
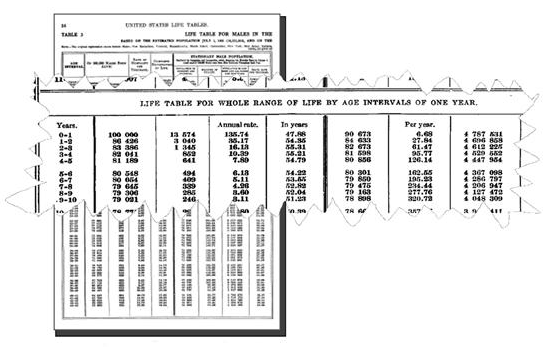 |
The above curves are average values of co-mingled genders. Again, it’s probably no surprise that, on average, women live longer. I’ll spare you all the gory details, but for the last couple of days I’ve been trawling through all the old life expectancy tables I could find that were published in the past, breaking these down by year of birth and gender (example shown on left for 1901). Not every year was available (thankfully, since my eyes have been going square typing in the figures), so I’ve used mathematical interpolation to fill in the gaps in between for the years that data was not available. |
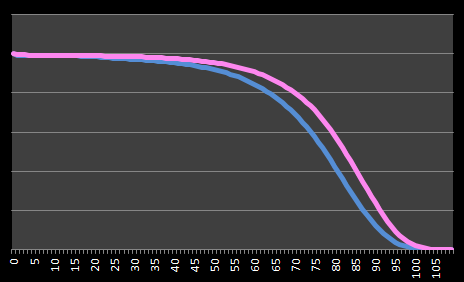
Below is a curve of the life expectancy curves showing the gender difference between men and women for 2009. Across all ages, women have lower mortality rates than men, and thus higher life expectancy.
Age at Death
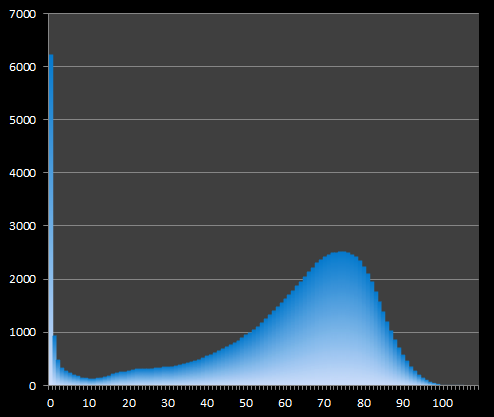
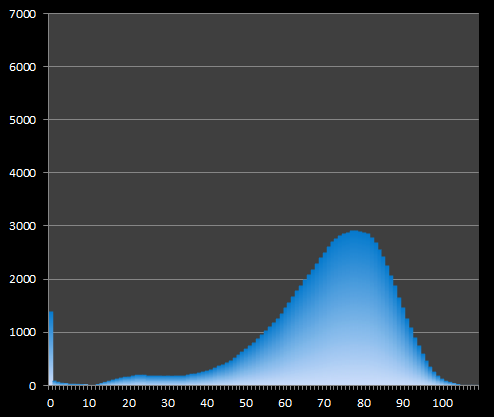
Another way to look at this same data is to plot out the Age at Death and the number of people (frequency) who die at that age. There's a short spike for newborns, then it resembles the shape of a skewed bell-curve
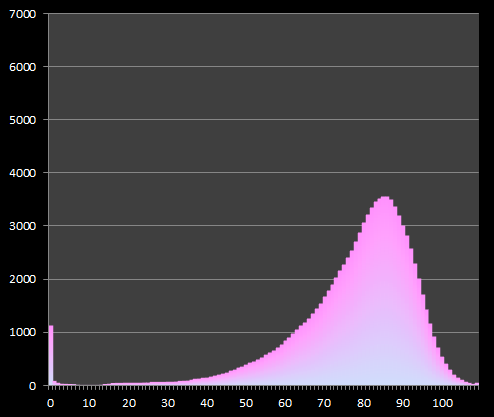
Here are histograms for male and female deaths for the 1930's. The male data is shown in blue, and the female in pink. The x-axis is the age at death, and the y-axis shows the number of people (out of every 100,000) that died at that age. [This is how the CDC likes to report their stats in reports they generate].
 |
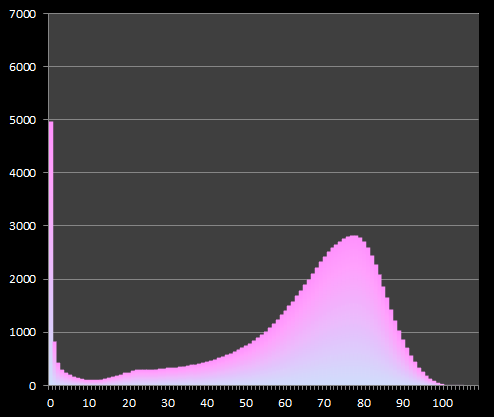 |
Below are similar charts for male and female deaths for the 1980's. You can see the pronounced reduction in infant mortality and the movement of the bell part of the curve to the right.
 |
 |
Returning to Taylor
So now we have a way to calculate the number of Taylors in the country.
The number of Taylors in the USA = (The number of Taylors born in 2010) + (The number of Taylors born in 2009 who are still alive) + (The number of Taylors born in 2008 who are still alive) + … + (The number of Taylors born in 1930 who are still alive) + (The number of Taylors born in 1929 who are still alive) + …
Here is a graphical representation of the distribution of Taylor’s based on age/gender showing the probability that a Taylor we encounter will be in that bucket. (Female are shown on the right, male on the left. Newborns are shown at the top of the graph, and old people at the bottom). For Taylor, it’s clear that it’s a modern name.
| % | AGE | % | ||
|---|---|---|---|---|
| 0.285% | 0 | 1.979% | ||
| 0.355% | 1 | 2.176% | ||
| 0.373% | 2 | 2.078% | ||
| 0.424% | 3 | 2.235% | ||
| 0.410% | 4 | 2.266% | ||
| 0.421% | 5 | 2.430% | ||
| 0.477% | 6 | 2.692% | ||
| 0.512% | 7 | 2.994% | ||
| 0.602% | 8 | 3.575% | ||
| 0.743% | 9 | 3.938% | ||
| 0.800% | 10 | 4.414% | ||
| 0.933% | 11 | 4.847% | ||
| 1.128% | 12 | 5.088% | ||
| 1.248% | 13 | 4.993% | ||
| 1.435% | 14 | 5.323% | ||
| 1.719% | 15 | 5.401% | ||
| 1.995% | 16 | 5.536% | ||
| 2.134% | 17 | 3.888% | ||
| 2.061% | 18 | 2.666% | ||
| 1.696% | 19 | 1.884% | ||
| 1.251% | 20 | 1.055% | ||
| 0.896% | 21 | 0.725% | ||
| 0.623% | 22 | 0.442% | ||
| 0.519% | 23 | 0.314% | ||
| 0.457% | 24 | 0.271% | ||
| 0.360% | 25 | 0.224% | ||
| 0.267% | 26 | 0.175% | ||
| 0.240% | 27 | 0.156% | ||
| 0.196% | 28 | 0.099% | ||
| 0.155% | 29 | 0.061% | ||
| 0.112% | 30 | 0.038% | ||
| 0.086% | 31 | 0.030% | ||
| 0.080% | 32 | 0.031% | ||
| 0.060% | 33 | 0.017% | ||
| 0.046% | 34 | 0.009% | ||
| 0.045% | 35 | 0.010% | ||
| 0.034% | 36 | 0.007% | ||
| 0.031% | 37 | 0.005% | ||
| 0.035% | 38 | 0.006% | ||
| 0.029% | 39 | 0.005% | ||
| 0.028% | 40 | 0.004% | ||
| 0.032% | 41 | 0.003% | ||
| 0.019% | 42 | 0.003% | ||
| 0.021% | 43 | 0.003% | ||
| 0.019% | 44 | 0.000% | ||
| 0.021% | 45 | 0.004% | ||
| 0.022% | 46 | 0.001% | ||
| 0.020% | 47 | 0.001% | ||
| 0.024% | 48 | 0.002% | ||
| 0.022% | 49 | 0.003% | ||
| 0.023% | 50 | 0.000% | ||
| 0.022% | 51 | 0.000% | ||
| 0.019% | 52 | 0.002% | ||
| 0.017% | 53 | 0.001% | ||
| 0.017% | 54 | 0.000% | ||
| 0.018% | 55 | 0.000% | ||
| 0.018% | 56 | 0.000% | ||
| 0.021% | 57 | 0.000% | ||
| 0.013% | 58 | 0.002% | ||
| 0.016% | 59 | 0.000% | ||
| 0.017% | 60 | 0.000% | ||
| 0.016% | 61 | 0.000% | ||
| 0.015% | 62 | 0.000% | ||
| 0.013% | 63 | 0.000% | ||
| 0.012% | 64 | 0.000% | ||
| 0.009% | 65 | 0.000% | ||
| 0.012% | 66 | 0.000% | ||
| 0.009% | 67 | 0.000% | ||
| 0.009% | 68 | 0.000% | ||
| 0.009% | 69 | 0.000% | ||
| 0.008% | 70 | 0.000% | ||
| 0.008% | 71 | 0.000% | ||
| 0.009% | 72 | 0.000% | ||
| 0.006% | 73 | 0.000% | ||
| 0.008% | 74 | 0.000% | ||
| 0.006% | 75 | 0.000% | ||
| 0.005% | 76 | 0.000% | ||
| 0.005% | 77 | 0.000% | ||
| 0.003% | 78 | 0.000% | ||
| 0.004% | 79 | 0.000% | ||
| 0.004% | 80 | 0.000% | ||
| 0.003% | 81 | 0.000% | ||
| 0.003% | 82 | 0.000% | ||
| 0.003% | 83 | 0.000% | ||
| 0.002% | 84 | 0.000% | ||
| 0.002% | 85 | 0.000% | ||
| 0.001% | 86 | 0.000% | ||
| 0.001% | 87 | 0.000% | ||
| 0.001% | 88 | 0.000% | ||
| 0.001% | 89 | 0.000% | ||
| 0.001% | 90 | 0.000% | ||
| 0.000% | 91 | 0.000% | ||
| 0.000% | 92 | 0.000% | ||
| 0.000% | 93 | 0.000% | ||
| 0.000% | 94 | 0.000% | ||
| 0.000% | 95 | 0.000% | ||
| 0.000% | 96 | 0.000% | ||
| 0.000% | 97 | 0.000% | ||
| 0.000% | 98 | 0.000% | ||
| 0.000% | 99 | 0.000% | ||
| 0.000% | 100 | 0.000% |
Easier on the eyes
To make the graphs a little bit easier to digest, I’ll broaden the buckets, and rather than showing a distinct line for each age, I’ll group them into bands of ten years to make the data a little more granular.
| % | AGE | % | ||
|---|---|---|---|---|
| 4.603% | 0-9 | 26.363% | ||
| 15.148% | 10-19 | 44.040% | ||
| 4.965% | 20-29 | 3.522% | ||
| 0.555% | 30-39 | 0.157% | ||
| 0.229% | 40-49 | 0.024% | ||
| 0.183% | 50-59 | 0.005% | ||
| 0.121% | 60-69 | 0.000% | ||
| 0.061% | 70-79 | 0.000% | ||
| 0.021% | 80-89 | 0.000% | ||
| 0.002% | 90-99 | 0.000% | ||
| 0.000% | 100-109 | 0.000% | Taylor |
The percentages on either side tell you the probability that a person you randomly meet with that name falls into that age/gender bucket.
In the next article I'll show some practical applications for this analysis. I'll leave you with a few more examples of other names.
More Examples
| % | AGE | % | ||
|---|---|---|---|---|
| 0.005% | 0-9 | 2.296% | ||
| 0.010% | 10-19 | 3.758% | ||
| 0.030% | 20-29 | 4.737% | ||
| 0.032% | 30-39 | 6.136% | ||
| 0.061% | 40-49 | 16.705% | ||
| 0.062% | 50-59 | 27.389% | ||
| 0.067% | 60-69 | 22.619% | ||
| 0.048% | 70-79 | 11.627% | ||
| 0.011% | 80-89 | 4.103% | ||
| 0.000% | 90-99 | 0.303% | ||
| 0.000% | 100-109 | 0.001% | Mary |
| % | AGE | % | ||
|---|---|---|---|---|
| 5.299% | 0-9 | 0.010% | ||
| 7.870% | 10-19 | 0.016% | ||
| 10.330% | 20-29 | 0.070% | ||
| 12.536% | 30-39 | 0.077% | ||
| 21.233% | 40-49 | 0.086% | ||
| 21.219% | 50-59 | 0.058% | ||
| 14.250% | 60-69 | 0.048% | ||
| 5.179% | 70-79 | 0.033% | ||
| 1.565% | 80-89 | 0.015% | ||
| 0.104% | 90-99 | 0.001% | ||
| 0.000% | 100-109 | 0.000% | John |
| % | AGE | % | ||
|---|---|---|---|---|
| 0.000% | 0-9 | 1.021% | ||
| 0.000% | 10-19 | 1.410% | ||
| 0.000% | 20-29 | 2.148% | ||
| 0.000% | 30-39 | 3.700% | ||
| 0.052% | 40-49 | 8.184% | ||
| 0.023% | 50-59 | 15.817% | ||
| 0.084% | 60-69 | 24.157% | ||
| 0.118% | 70-79 | 25.042% | ||
| 0.051% | 80-89 | 16.467% | ||
| 0.003% | 90-99 | 1.716% | ||
| 0.000% | 100-109 | 0.007% | Florence |
| % | AGE | % | ||
|---|---|---|---|---|
| 0.000% | 0-9 | 0.357% | ||
| 0.000% | 10-19 | 0.532% | ||
| 0.000% | 20-29 | 1.050% | ||
| 0.000% | 30-39 | 2.816% | ||
| 0.053% | 40-49 | 8.542% | ||
| 0.086% | 50-59 | 19.474% | ||
| 0.119% | 60-69 | 27.793% | ||
| 0.169% | 70-79 | 24.220% | ||
| 0.060% | 80-89 | 13.274% | ||
| 0.004% | 90-99 | 1.442% | ||
| 0.000% | 100-109 | 0.008% | Ethel |
| % | AGE | % | ||
|---|---|---|---|---|
| 3.030% | 0-9 | 0.000% | ||
| 3.786% | 10-19 | 0.000% | ||
| 5.175% | 20-29 | 0.042% | ||
| 7.757% | 30-39 | 0.073% | ||
| 14.399% | 40-49 | 0.082% | ||
| 24.448% | 50-59 | 0.095% | ||
| 23.850% | 60-69 | 0.100% | ||
| 11.719% | 70-79 | 0.076% | ||
| 4.936% | 80-89 | 0.045% | ||
| 0.382% | 90-99 | 0.003% | ||
| 0.001% | 100-109 | 0.000% | Harry |
| % | AGE | % | ||
|---|---|---|---|---|
| 4.598% | 0-9 | 0.007% | ||
| 6.714% | 10-19 | 0.019% | ||
| 8.875% | 20-29 | 0.063% | ||
| 11.782% | 30-39 | 0.087% | ||
| 19.436% | 40-49 | 0.096% | ||
| 22.706% | 50-59 | 0.074% | ||
| 15.771% | 60-69 | 0.055% | ||
| 7.041% | 70-79 | 0.042% | ||
| 2.454% | 80-89 | 0.020% | ||
| 0.161% | 90-99 | 0.001% | ||
| 0.000% | 100-109 | 0.000% | Edward |
| % | AGE | % | ||
|---|---|---|---|---|
| 2.453% | 0-9 | 0.000% | ||
| 4.280% | 10-19 | 0.009% | ||
| 6.822% | 20-29 | 0.070% | ||
| 9.567% | 30-39 | 0.115% | ||
| 14.977% | 40-49 | 0.144% | ||
| 22.466% | 50-59 | 0.152% | ||
| 20.507% | 60-69 | 0.137% | ||
| 12.556% | 70-79 | 0.102% | ||
| 5.207% | 80-89 | 0.047% | ||
| 0.383% | 90-99 | 0.003% | ||
| 0.001% | 100-109 | 0.000% | Clarence |
| % | AGE | % | ||
|---|---|---|---|---|
| 0.007% | 0-9 | 16.808% | ||
| 0.007% | 10-19 | 8.145% | ||
| 0.023% | 20-29 | 4.775% | ||
| 0.006% | 30-39 | 4.228% | ||
| 0.012% | 40-49 | 8.105% | ||
| 0.034% | 50-59 | 14.777% | ||
| 0.057% | 60-69 | 18.461% | ||
| 0.086% | 70-79 | 16.529% | ||
| 0.026% | 80-89 | 7.213% | ||
| 0.002% | 90-99 | 0.696% | ||
| 0.000% | 100-109 | 0.003% | Clara |
| % | AGE | % | ||
|---|---|---|---|---|
| 0.001% | 0-9 | 0.542% | ||
| 0.003% | 10-19 | 1.126% | ||
| 0.016% | 20-29 | 3.153% | ||
| 0.032% | 30-39 | 8.964% | ||
| 0.067% | 40-49 | 28.301% | ||
| 0.059% | 50-59 | 40.209% | ||
| 0.032% | 60-69 | 16.370% | ||
| 0.003% | 70-79 | 1.008% | ||
| 0.000% | 80-89 | 0.105% | ||
| 0.000% | 90-99 | 0.008% | ||
| 0.000% | 100-109 | 0.000% | Susan |
| % | AGE | % | ||
|---|---|---|---|---|
| 0.026% | 0-9 | 14.418% | ||
| 0.041% | 10-19 | 25.962% | ||
| 0.127% | 20-29 | 31.304% | ||
| 0.048% | 30-39 | 13.468% | ||
| 0.016% | 40-49 | 4.813% | ||
| 0.011% | 50-59 | 4.069% | ||
| 0.010% | 60-69 | 3.267% | ||
| 0.009% | 70-79 | 1.734% | ||
| 0.002% | 80-89 | 0.621% | ||
| 0.000% | 90-99 | 0.054% | ||
| 0.000% | 100-109 | 0.000% | Sarah |
| % | AGE | % | ||
|---|---|---|---|---|
| 0.000% | 0-9 | 1.086% | ||
| 0.000% | 10-19 | 1.261% | ||
| 0.000% | 20-29 | 1.770% | ||
| 0.000% | 30-39 | 3.441% | ||
| 0.000% | 40-49 | 7.829% | ||
| 0.062% | 50-59 | 18.973% | ||
| 0.162% | 60-69 | 29.933% | ||
| 0.168% | 70-79 | 23.166% | ||
| 0.046% | 80-89 | 10.952% | ||
| 0.003% | 90-99 | 1.141% | ||
| 0.000% | 100-109 | 0.007% | Minnie |
| % | AGE | % | ||
|---|---|---|---|---|
| 3.381% | 0-9 | 0.005% | ||
| 6.420% | 10-19 | 0.016% | ||
| 11.162% | 20-29 | 0.077% | ||
| 14.122% | 30-39 | 0.087% | ||
| 24.016% | 40-49 | 0.095% | ||
| 22.477% | 50-59 | 0.060% | ||
| 12.224% | 60-69 | 0.042% | ||
| 4.462% | 70-79 | 0.026% | ||
| 1.242% | 80-89 | 0.012% | ||
| 0.073% | 90-99 | 0.001% | ||
| 0.000% | 100-109 | 0.000% | Paul |
| % | AGE | % | ||
|---|---|---|---|---|
| 4.602% | 0-9 | 4.670% | ||
| 7.611% | 10-19 | 8.329% | ||
| 9.291% | 20-29 | 8.938% | ||
| 6.382% | 30-39 | 3.539% | ||
| 6.463% | 40-49 | 3.263% | ||
| 6.743% | 50-59 | 5.499% | ||
| 5.071% | 60-69 | 6.966% | ||
| 2.906% | 70-79 | 5.648% | ||
| 1.016% | 80-89 | 2.719% | ||
| 0.068% | 90-99 | 0.274% | ||
| 0.000% | 100-109 | 0.001% | Jessie |
You can find a complete list of all the articles here. Click here to receive email alerts on new articles.
© 2009-2013 DataGenetics