
A geek plays darts
Darts is a very common English pastime. It involves the hand launching of sharp projectiles at a wall-mounted target from a distance of approximately 8 feet.
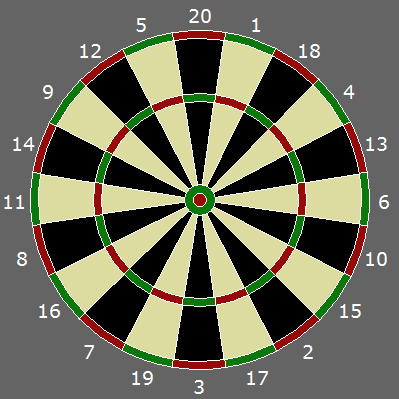 |
The circular target (dart board) is divided into twenty radial segments with basic point values ranging from 1 to 20 points. In addition, there are two narrow annular rings, one at the edge of the board (the "double"); a dart landing in this region scores double the segment value, and a "triple" ring which runs around the middle of the segments (scoring three times the basic segment value). Finally, at the center of the board are two scoring regions (the "Bullseye"). The very center "inner bull" scoring 50 points, and the ring outside the "outer bull" scoring 25. The image to the left is picture of a regulation dartboard, as created by Brian Gamlin in 1896. As you can see, the numbers are arranged in a pattern designed to penalize inaccuracy, with high scoring segments placed adjacent to lower scoring regions. |
Highest Score
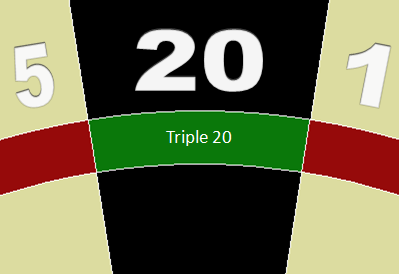 |
It doesn’t take a mathematician to calculate that the highest score achievable with a single dart is 60 points. This is achieved be successfully hitting the triple 20. This, however, is not as easy as it sounds. The triple 20 comprises an area of just 259 mm2 (that’s 4/10ths of a square inch for my metrically challenged readers). In percentage terms, this represents less than 0.9% of the scoring region of the dart board. |
Hitting the triple 20 consistently takes a considerable amount of skill (after all, this is the equivalent of hitting an area less than the size of a postage stamp from eight feet away). Even professional players are not able to hit this region all the time, and the point penalty for inaccuracy can be severe with the low scoring regions of 5 and 1 being immediately on either side.
Where to aim
|
Where is the best place for a player to aim, knowing the inaccuracies of throwing? What is the optimal strategy? Where should a player aim in order to obtain the highest expected outcome over many throws? Should they aim for the triple 20, with a big payout on a success, but a low score from a miss? Or, should they aim for the bullseye? Alternatively, is there some other optimal location on the board they can aim for that, whilst not the highest scoring region, has a large exapnse of middle of the road point values. Would aiming for this region, even with an inaccurate shot, get a reasonable number of points such that, on average, the expected score is the highest that can be achieved? The true answer to this riddle, as we will see, is that "it depends…" |
 |
The optimal strategy for aiming depends on your skill as darts player. A very skillful player should aim for the middle of the triple 20; Much of the time he will hit his target, and the times he misses will be few enough that his average score will still be high.
A very poor player should aim close to the bullseye, as just hitting the board will be an achievement (and a scoring one at that!). Aiming for the center maximizes the chances of hitting something.
But what happens between these two extreme?
Normal Distribution
I’m going to model a dart throw by assuming a player aims at an objective, and their accuracy of hitting this objective is distributed according to a Gaussian distribution function. I’ll spare the math, but sufficient to say there is a probability density function which is shaped like a “bell” and this shape describes the probability that a dart will land in this location. It’s highest at the objective (the center), and falls off symmetrically the further away from the objective travelled. (You may have also heard this distribution called a ”Normal Distribution”).
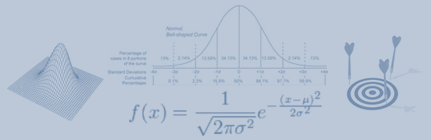 |
An elegant stochastic mathematical formula describes the shape of the curve; we’ll use this formula to represent the probability that the dart will land that far away from the objective (The area under the curve is 1.0; the dart has to land somewhere!). One of the parameters of the function is something called the Standard Deviation, represented by the small Greek letter Sigma σ. |
Standard Deviation (σ)
|
Again there’s a lot of math related to standard deviation, but the easiest way to think about σ is that it’s a measure of the “average deviation around the average”. If you are a good darts player, you will have a low standard deviation, and your shots will be closely clustered around their intended objective.  |
 |
A medium skilled darts player will have a larger standard deviation; even though the shots may, on average, be centered around the same target, they will be distributed over a broader region. A poor darts player will have a high standard deviation and their shots will be, probabilistically, scattered over a much wider region. 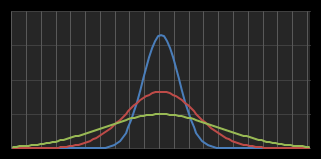
|
 |
Superposition
Now that we have a curve to describe the probability of a where a dart will land based on a target and standard deviation, we can sweep this curve over the board and calculate the expected score for each possibly aiming location. (Because of the stochastic nature of the probability distribution function, we simple multiply the probability of the dart landing at a certain location by the point scored at that location, then integrating this for the entire board).
The result is something like this, which is a plot for σ=17 mm
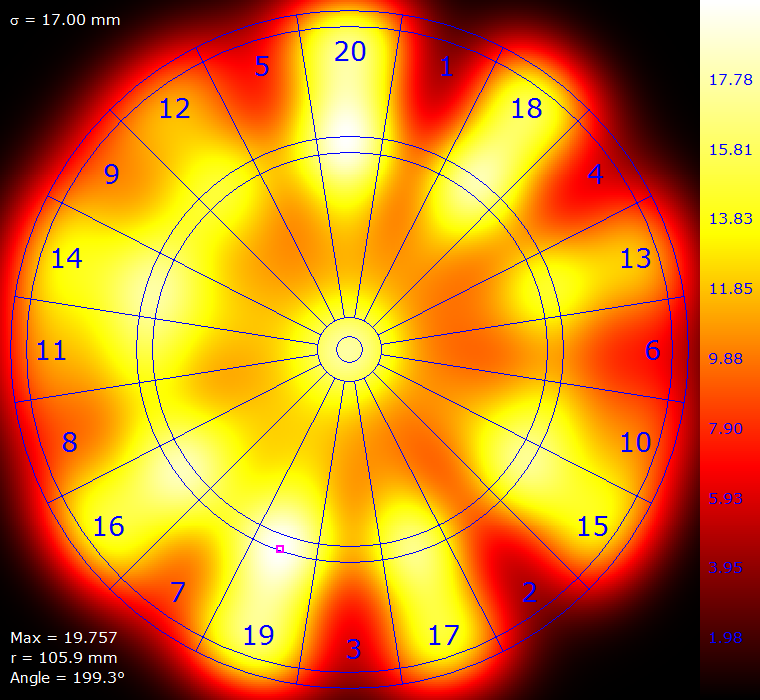
Colour is used to represent the expected score. There is a legend on the right giving the scale. The optimal location to aim (the highest achievable expected score) is represented by the magenta reticle. It's value and coordinates are described in the lower left corner.
For this value of standard deviation, the higest expeceted score is 19.757 which is obtained by aiming just inside the triple 19 segment. (The coordinates for this location are represented in Polar format as a radius measured from the center of the board in mm, and an angle, measured from 12'o'clock, in degrees).
Results from a range of σ
Here are some results for a selection of increasing σ.
By definition, with a σ=0 mm there is no variance in the shot, and every dart lands perfectly on target. The maximum expected score for σ=0 mm is 60, and this can be achieved by aiming anywhere inside the triple 20 segment.
(Click on any of the images below for a Hi-Res version.)
 |
 |
|
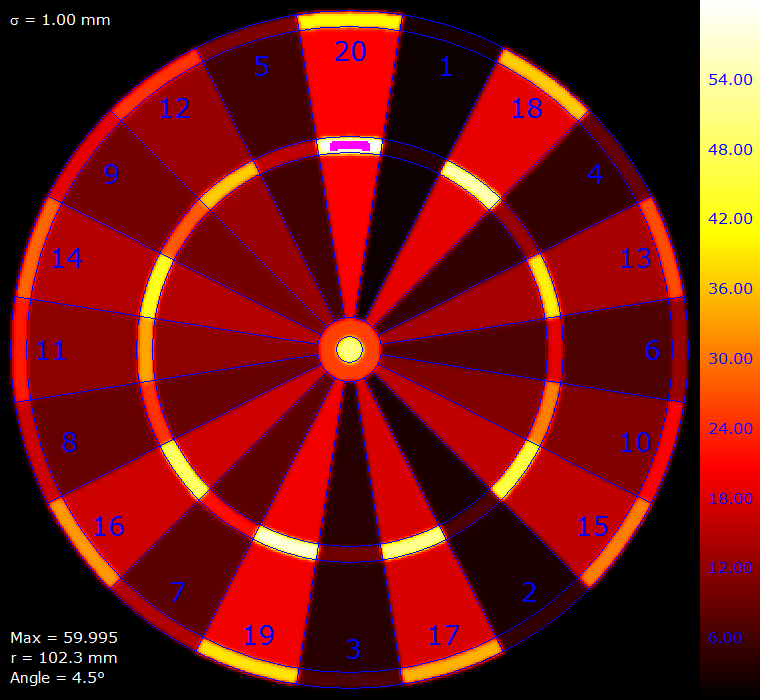
With σ=1 mm the deviance is very small, and just about all shots taken hit their intended target. The maximum expected score is 59.995. With this low σ, the tail of the curve falls off so rapidly such that, even with double floating point precission, there are a range of coordinates that all achieve this same expected outcome. This is show as the Magenta bar on the above picture. |
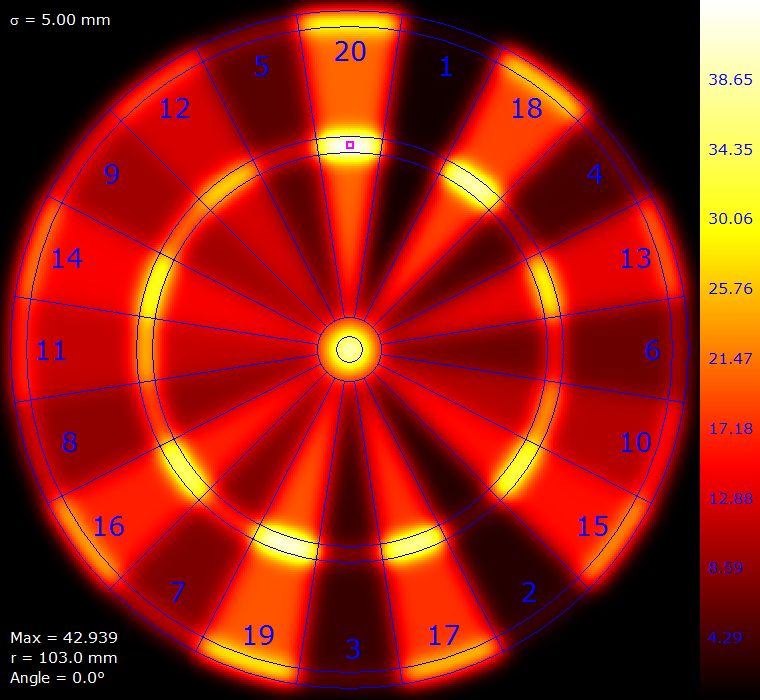
Increasing the σ to 5 mm creates a slight 'bloom' around each of the segments, and whilst the maximum expected score has lowered to 42.939, the aiming location is still centered in the middle of the triple 20. |
|
| ||
 |
 |
|
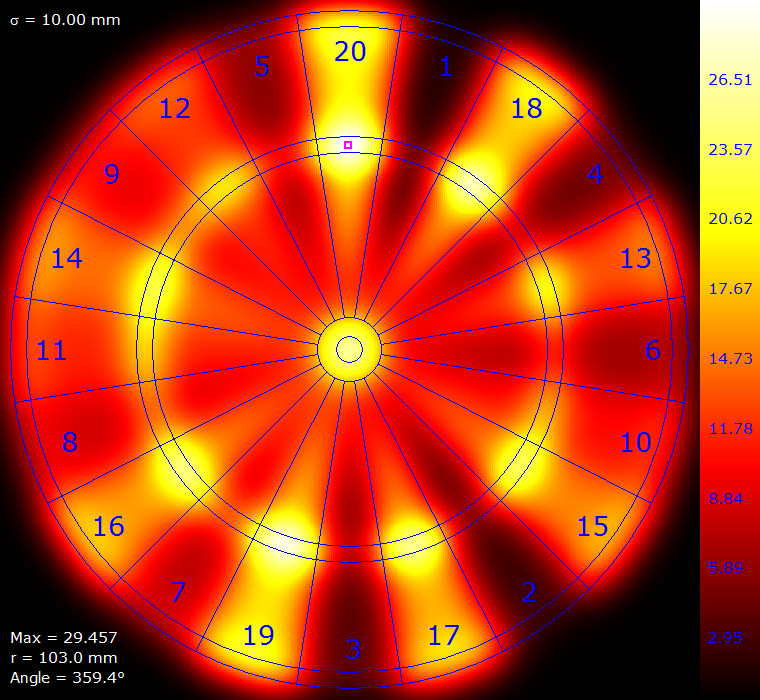
By the time that σ has increased to 10 mm, the maximum expected score has decreased to 29.457 The Gaussian blur around the triple 20 is skewed slightly to the left (closer to the 5 segment on the left than the 1 segment on the right) – if you are going to drift horizontally, you'll achieve a slightly higher score by going that way. You can see the angle has changed to 359.4° |
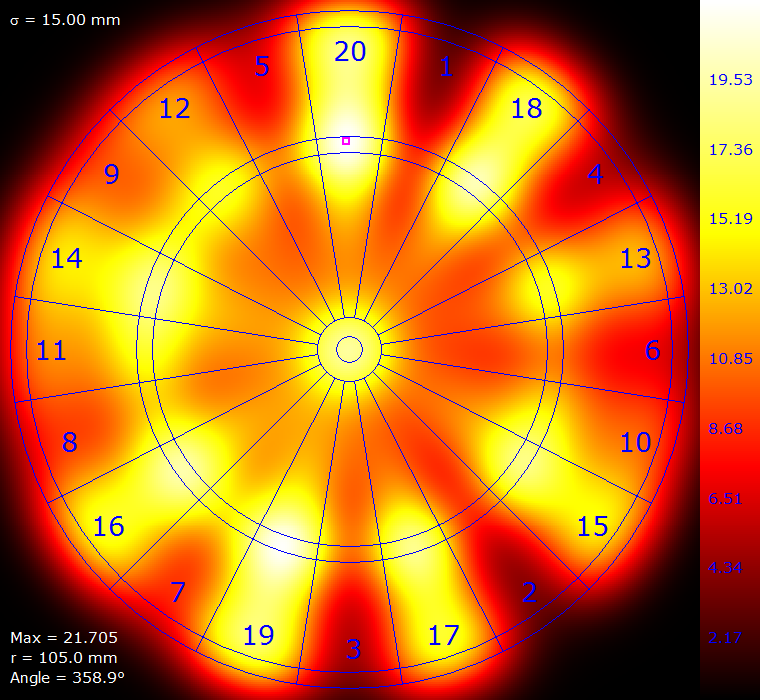
At σ=15 mm, this left drift continues (and the optimal location moves outwards slightly so that the probable circular distribution pattern, if it falls outside the 20 segment, is more likely to land in the triple 5 location than just the vanilla 5 area). The maximum expected score is now 21.705 |
|
| ||
 |
 |
|
As we saw from the first σ=17 mm image, the maximum scoring location jumps from the triple 20 region to the triple 19 region (It makes this transition just before σ=16˝mm). The above image is the pattern for σ=20 mm. Interestingly, at this time, the optimal aiming point is just outside the triple 19 ring. |
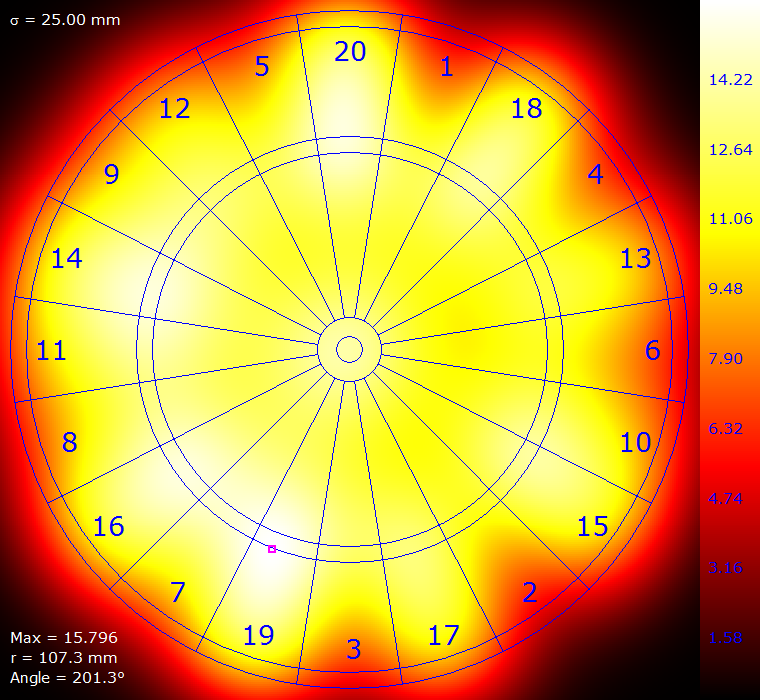
At σ=25 mm, it's still just outside, and the maximum expected score is down to 15.796 |
|
| ||
 |
 |
|
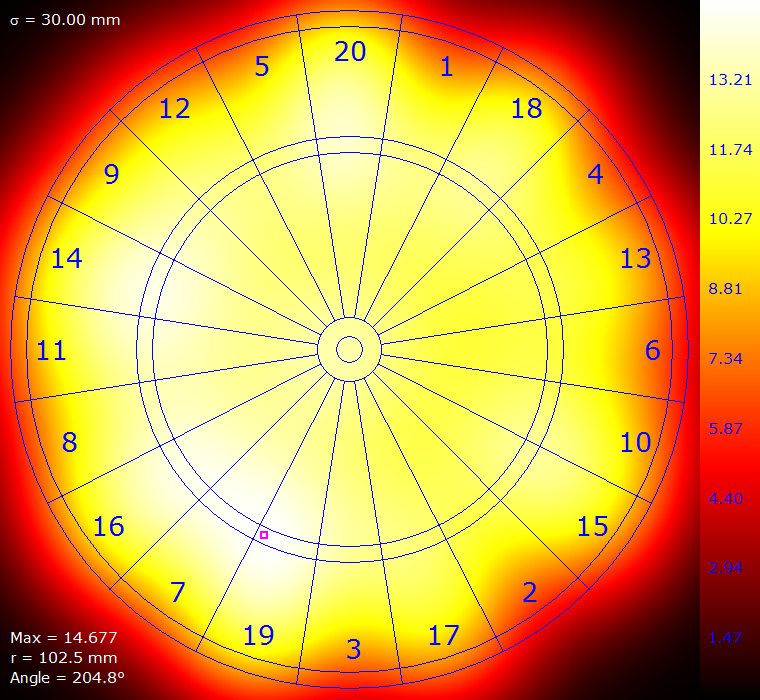
At σ=30 mm, the optimal aiming position has moved inside the triple 19, as it starts its migration up and around (more on this later …) |
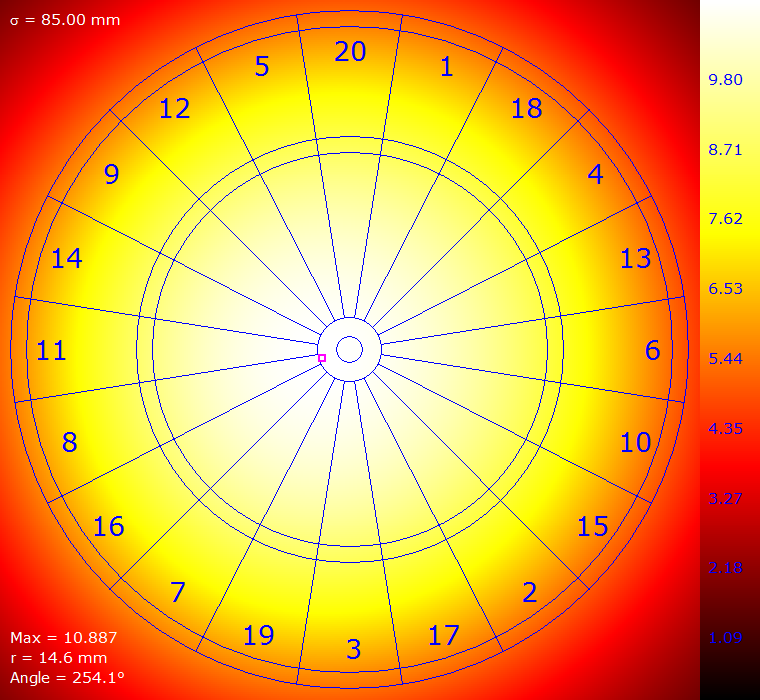
At σ=85 mm, as predicted, it's moved close to the bullseye, where it stays from this point onwards. |
|
NOTE– Each of the above images was normalised onto it's own private colour range.
Movie
Here is a short animation showing the change in probability distribition with the change in σ from 1mm to 100mm in 1mm increments.

Somethings look even better in 3D
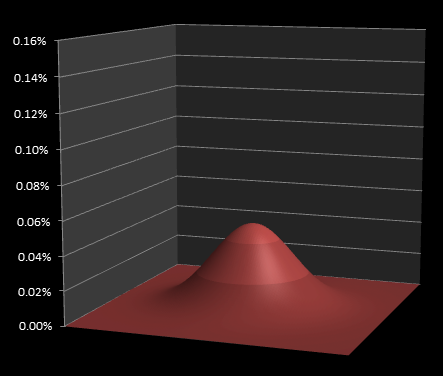
Geeking out, here are some plots of the probability functions in 3D. Click on each image to view it in full resolution.
 |
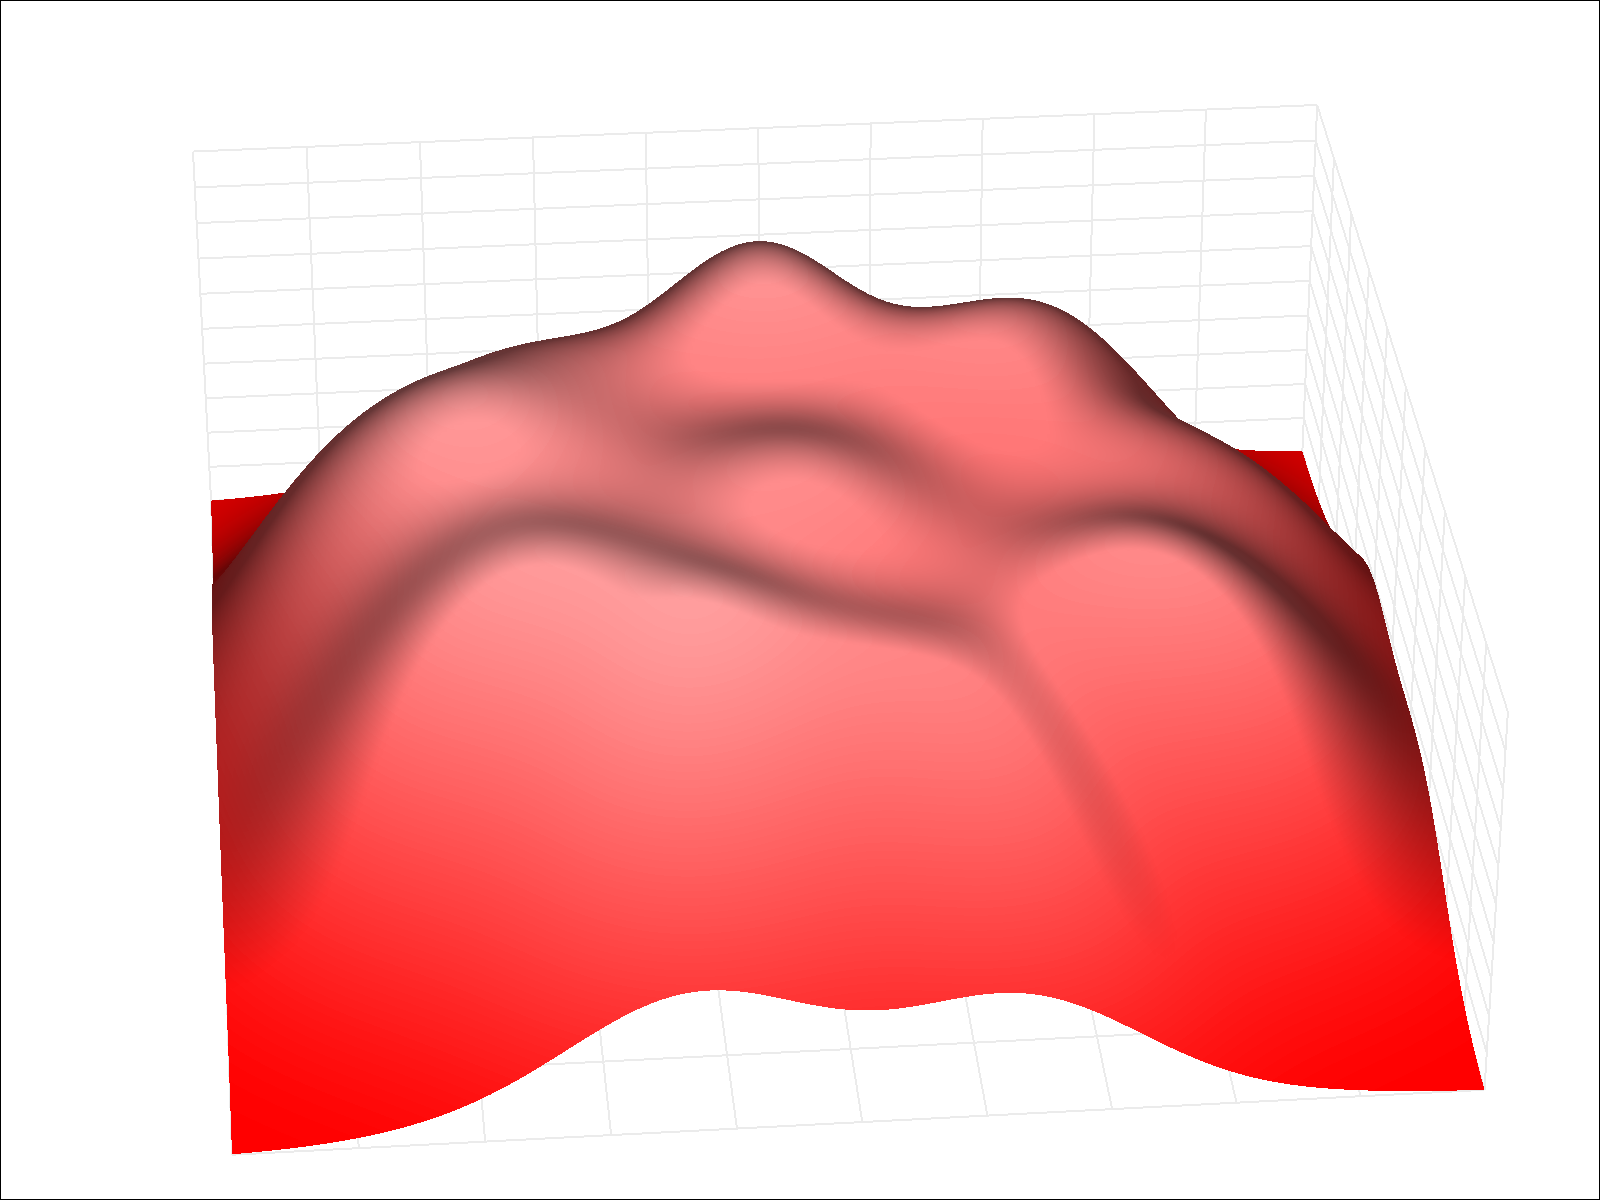
σ=2 mm With a very low σ, each scoring segment looks like a tower with (almost) the height of the scoring region, and Gaussian blurred edges. The highest 'peak' is the triple 20. |
| |
σ=16 mm As σ increases, the towers spread out and diffuse into each other. At this level of σ the maximum value is still in the triple 20 region. |
 |
| |
 |
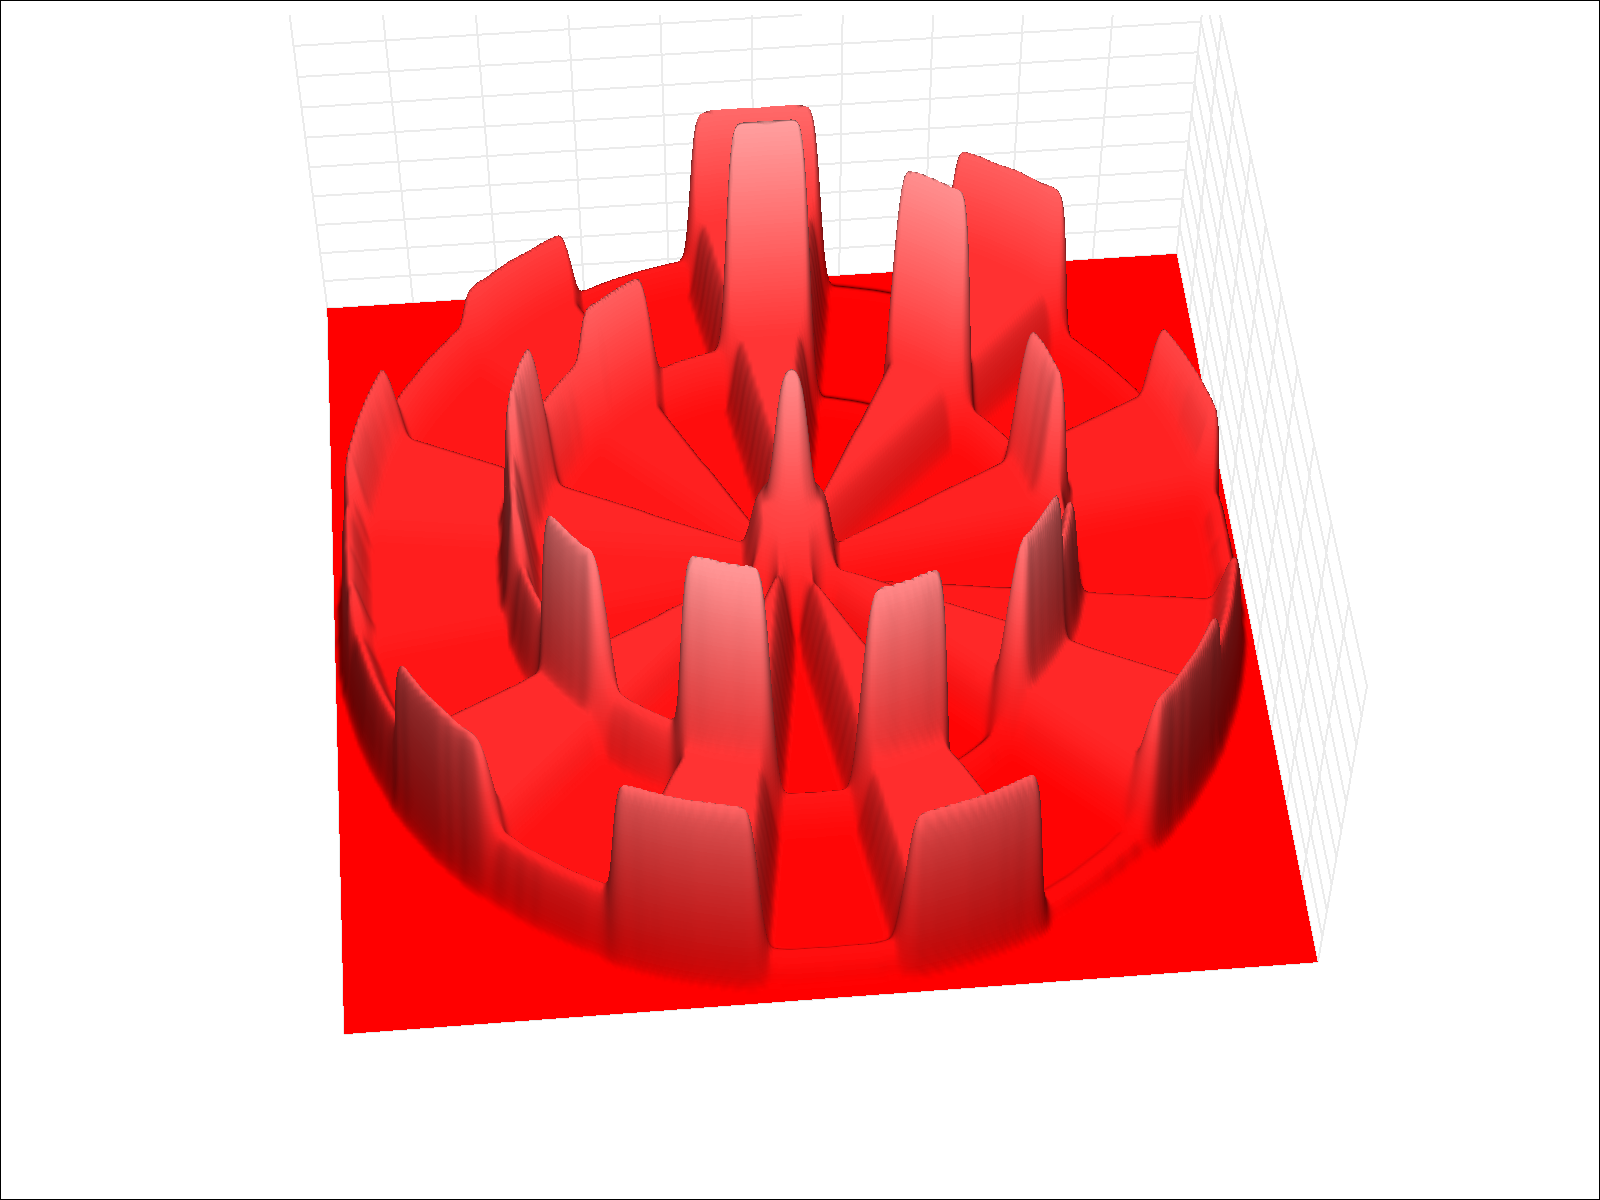
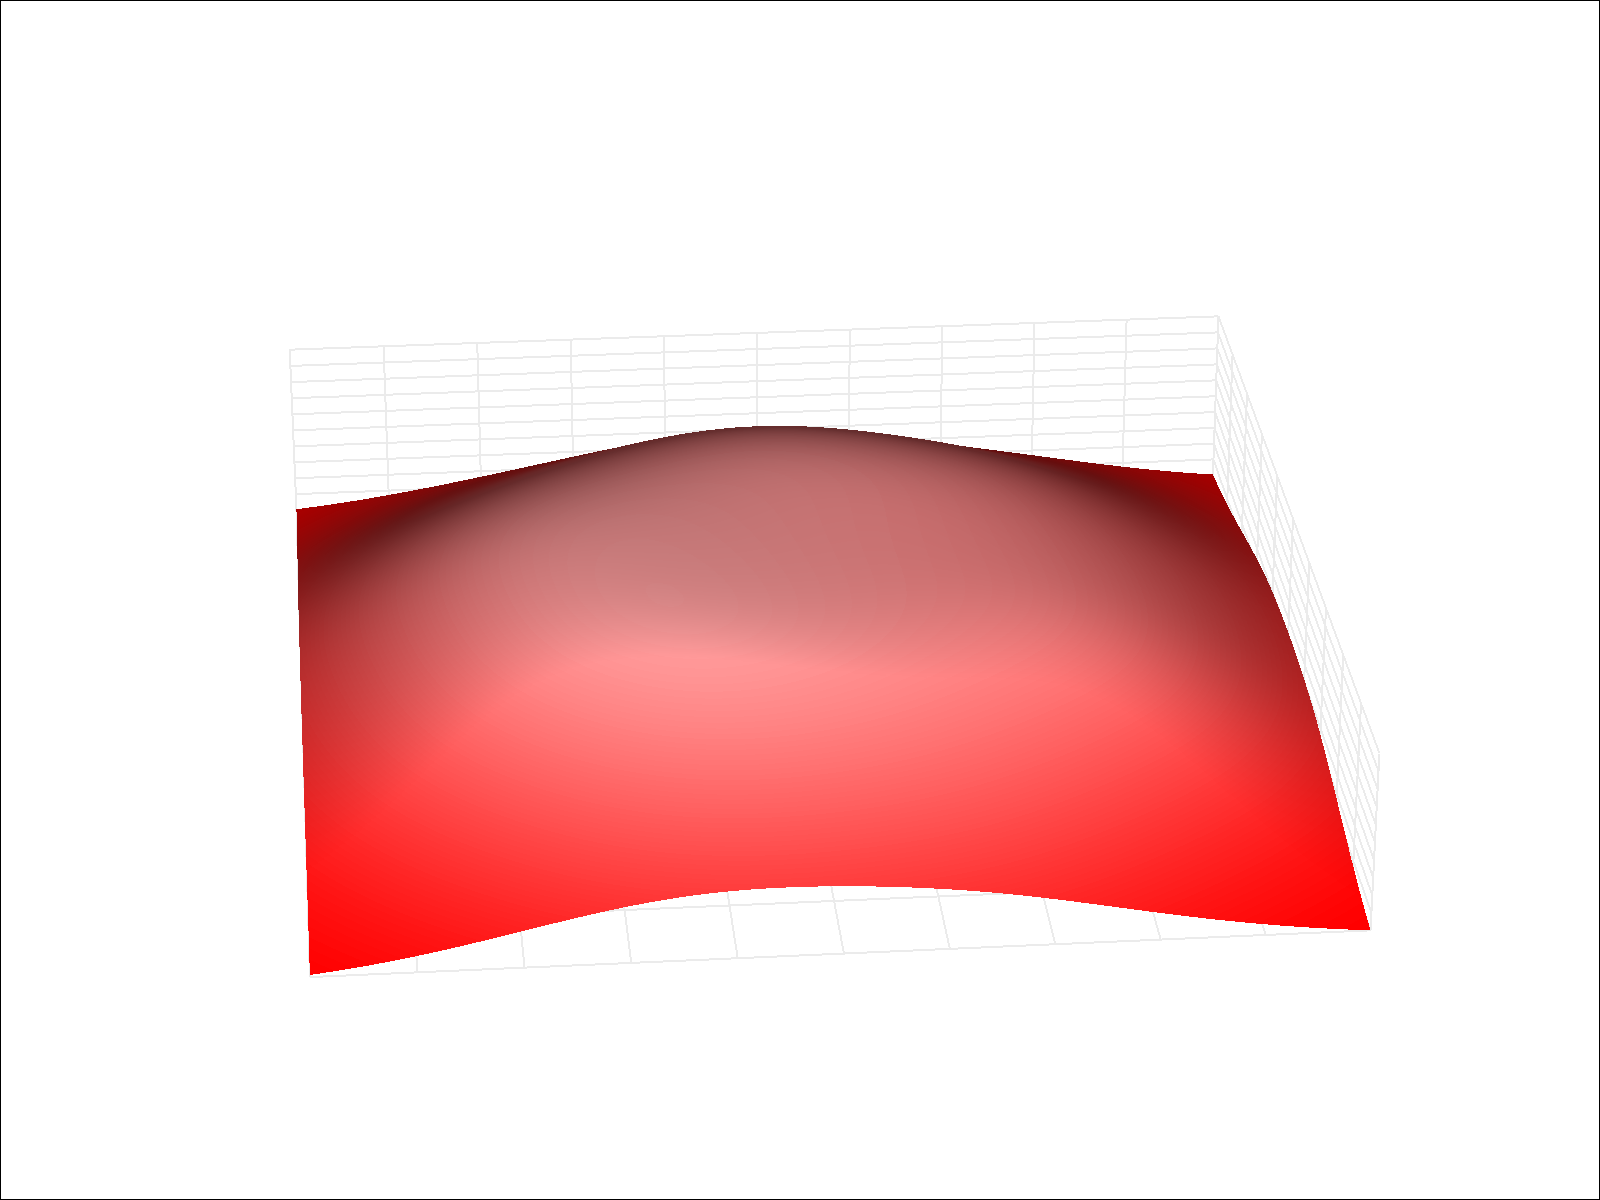
σ=30 mm The hills have now spread out much further and become lower and broader. The highest value is now close to triple 19. |
| |
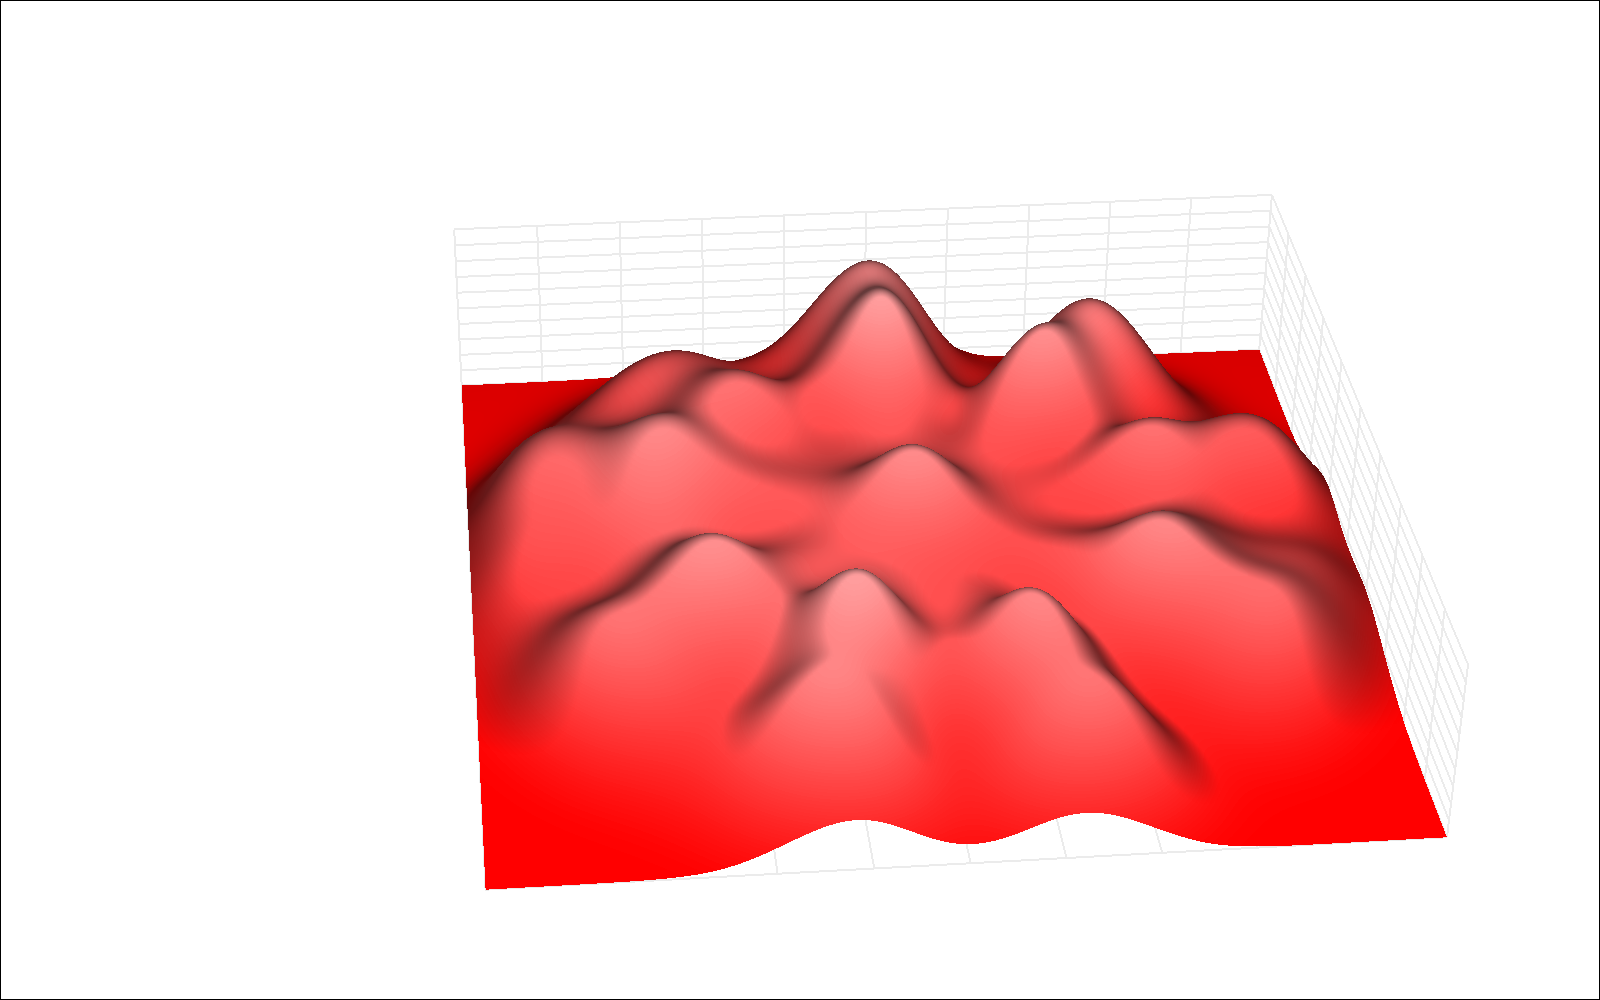
σ=50 mm Now it's no longer possible to identify the individual peaks, and a much flatter plateau develops. |
 |
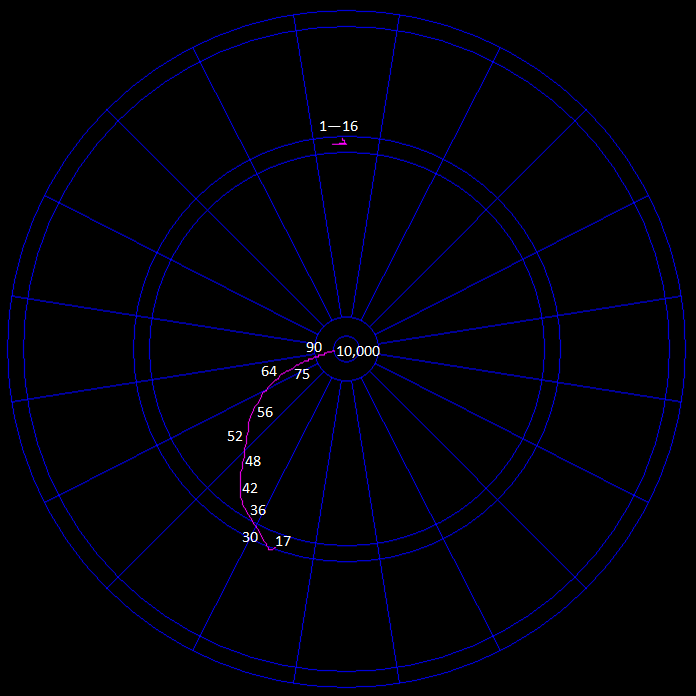
Migration of the optimal aiming point
Here's a plot of how the maximum expected value peak migrates around the board with increasing σ. For low values of σ it is in the triple 20 region. It jumps to the triple 19 region, then curls and moves around the lower left region of the board until ending up just inside the inner bullseye for incredibly large values of σ.
Decline in score
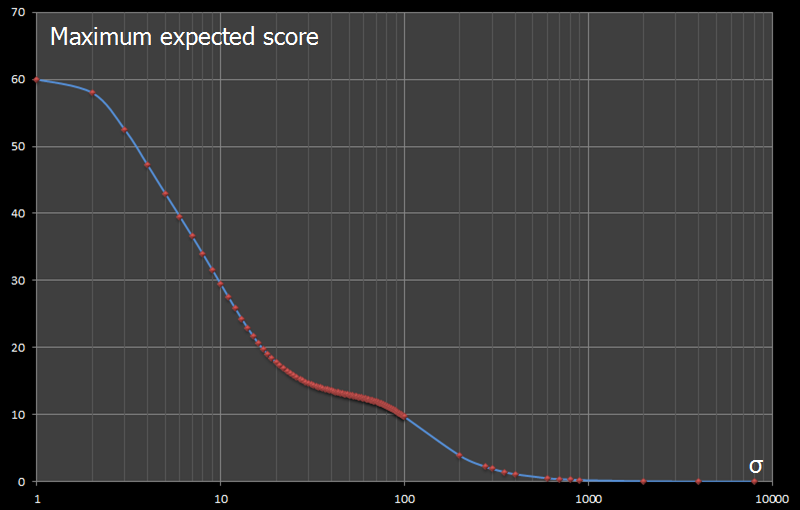
As accuracy decreases and σ increases, the highest achievable expected scores also falls. Here is a plot of the highest expected score against σ.
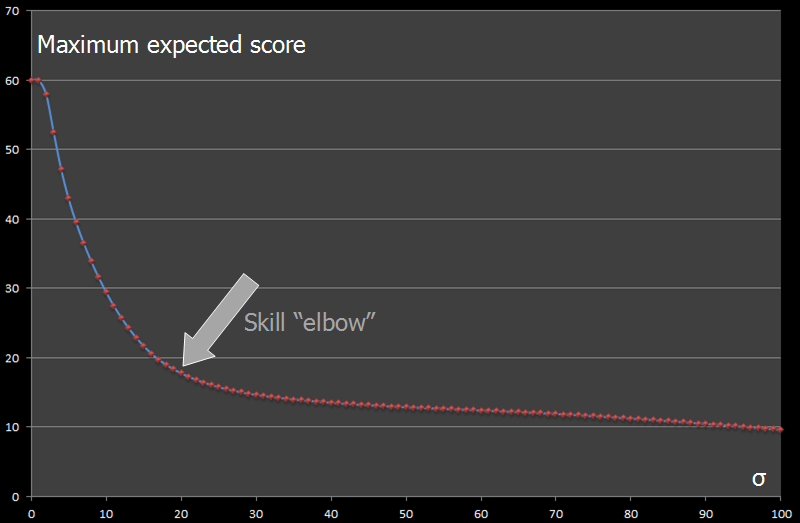
With medium to high values of σ the expected score is between 10 and 15 points, but as σ is reduced there is a sharp elbow in the curve, and highest expected score increases rapidy. This elbow occurs around σ=20 mm.
Players with values of σ higher than this elbow value will obtain poor scores at darts, whilst those with better accuracy (smaller σ) will achieve much higher scores. The difference in gradients either side of this eblow value is so severe that if two players, one either side of this threshold, play it's pretty much game over for the less accurate player.
Darts is a game in which the difference between a mediocre player and a good player manifests itself so savagely that it will be a very one-sided game if two players of different skills play.
As σ increases further, there is a second eblow in the curve. This happens because the probabily density cloud starts to become so large that there is a good chance that a thrown dart will miss the board completely! A missed dart does not score, and reduces the expected value. As σ increases, the maximum expected value asymptotes to zero.
Below is a plot of larger values of σ against maximum expected score. In this graph, the x-axis, showing σ is plotted in log scale.
Estimating your σ
How would you go about estimating your σ?
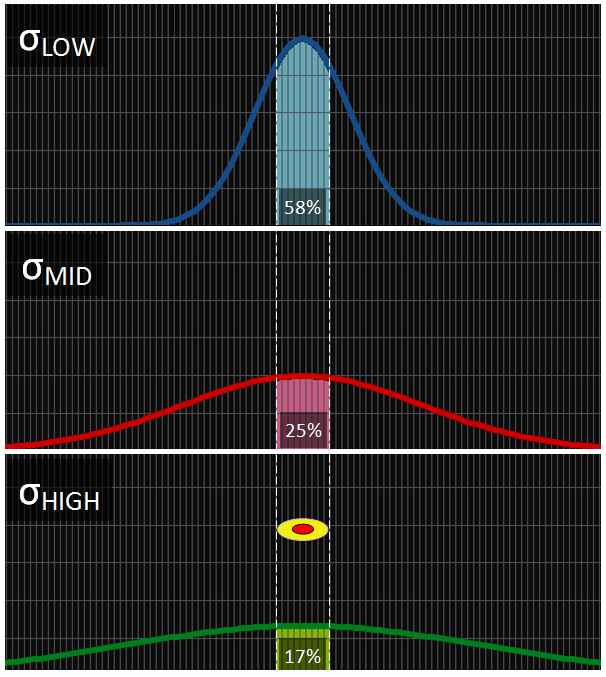
Using a cummulative version of the probability density function, it's possible to calculate the probability of hitting within a certain radius (the shaded region in the image below) based on a value of σ. Low values of σ have a very tall and narrow peak so that a high percentage of the area under the curve will be within a certain radius. As σ increases, the curves get broader and shallower and a increasingly smaller region of the curve will be under the same two bounds.
Throw 50 darts at the bullseye and count the number of darts that land within the outer bull. Then look up this number on the table to the right and read off the corresponding value for σ
|
|
Are you a good darts player?
Remember back to the elbow on the maximum expected results chart which occured around σ=20 mm?
Reading this on the table above, this corresponds to approximately 23/50 hits on the bullseye. So, if can aim at the bullseye of a dart board, and can consistently get half your darts inside the outer bull of the board, then you are on the steep part of the scoring and probably a hard player for an amateur to beat!
 |
If you enjoyed reading this posting, you might also enjoy some of my other postings on classic card and board games: Battleships, Chutes & Ladders, Candyland and Risk). |
Update
Since releasing this post, it has been brought to my attention that a substantial statistics paper on this subject has already been published. This excellent paper, written by Ryan J. Tibshirani, Andrew Price, and Jonathan Taylor was published in 2011. This paper goes into considerable more mathematical depth than my article, and continues on to consider the modifications to the distributions that occur with asymmetry, and non-circularly symmetric distribution of variance. I encourage anyone interested in learning more to read their paper.
You can find a complete list of all the articles here. Click here to receive email alerts on new articles.

© 2009-2013 DataGenetics